Within this lab, we learned about the relationship between volume, pressure, and temperature, and derived the ideal gas law.
 |
| The picture of our can theory |
In our first portion of the class, we theorized what would occur to a soda can with 13mL of water at 100°C, if it were to be placed in a container of water at room temperature
We predicted that the can would quickly implode
 |
| The video of the experimentation |
 |
| End Result of our lab |
We were able to correctly predict that due to the gas particles overtaking the can, the can as a result will quickly implode
 |
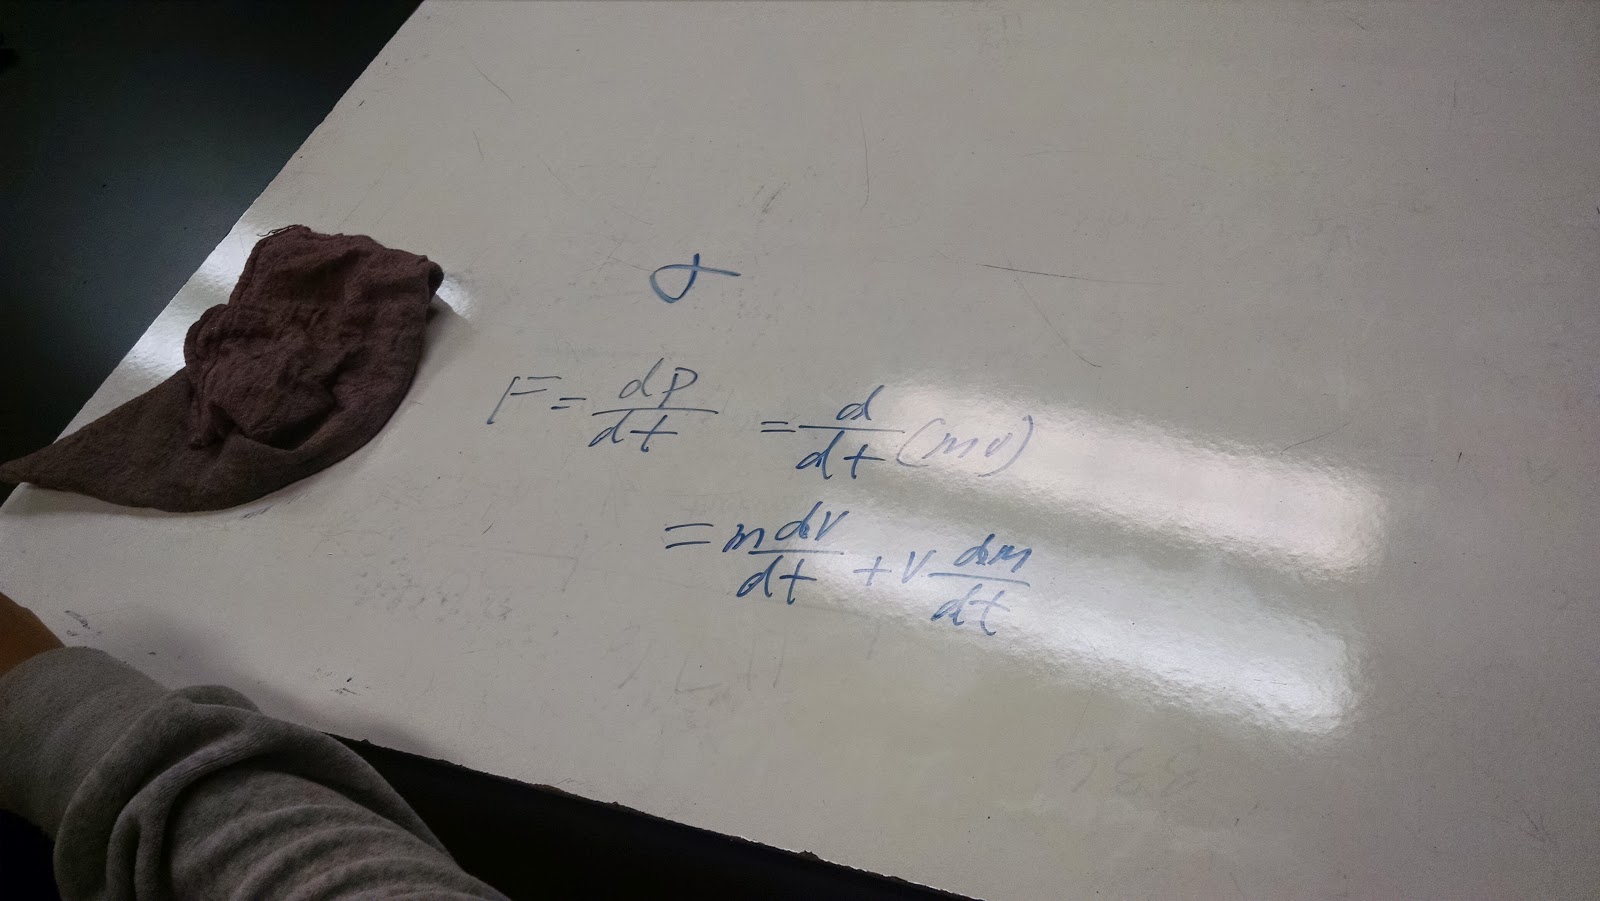
| Our depiction of the relationship between force and momentum |
During the class, we were asked to find the correlation between force and momentum. Using Newton's Second Law and the equation for momentum, we were able to successfully find a relationship, that force and momentum are directly proportional to each other
 |
Unfortunately, I do not have a pic of me doing the experimentation
But look! A manometer |
We then entered our first class lab, using a manometer to measure gas pressure. By blowing on one end of the tube after keeping the water at equilibrium, and measure the difference in the height, we were able to successfully find the gas pressure
 |
| Calculations of the manometer, as well as finding pressure |
 |
| Our predictions of the three graphs |
The next part of the lab asked us to make theories of three different types of graphs, pressure vs. temperature, volume vs temperature and pressure vs volume, as we went through each of these experiments to see whether or not these predictions holds true or not.
 |
| Forgot to take a real life picture of the apparatus |
Our first graph that we proved was the pressure vs volume temperature. We did so by using loggerpro, a pressure sensor, and a 20cc syringe. By setting the Logger-pro to collect data per certain points(event mode) we were able to graph the pressure using the volume as points.
 |
Not the cleanest line, but it shows an inverse
proportion relationship |
The graph that appeared, although not as clear as we would like, shows that pressure and volume has an inversely proportional relationship, which is just about what we predicted in our theory
 |
| The speech of the P v T graph |
The second portion of the experiment involved finding the relationship between pressure and temperature. By using the pressure sensor and hot water + ice, we can see the change of temperature, and also examine how the pressure changed along with it.
 |
| Yet another messy graph |
Although the graph is a bit messy, it is showing what should be a straight line, which proves that pressure and temperature are directly proportional to each other. Once again, our prediction is correct
We now hit into the final portion of this experiment, volume vs temperature by using a near-frictionless syringe.This lab involved using using three different containers of water in different temperature, one at about 70°C, one at room temp, and one at 0°C.
 |
| The video for the volume vs temperature experiment |
 |
| A much cleaner graph |
As the (beautiful) graph shows a (beautifully) straight line, we once again prove to be correct in our prediction that as temperature changes, volume changes as a direct proportion.
 |
The idea is the the two graphs reshows the inverse proportion
between pressure and volume (while temperature is constant) |
We then took the equations from both the pressure vs temperature and the volume vs temperature, and created a relationship with each other
 |
| A class problem, involving finding pressure of a diving bell after it leaves the surface |
 |
| The answer(s) to the the complex diving bell question |
 |
| Our theory about what should occur to the balloon |
Our next portion of the lab required two parts, but asked the same question; what would happen if you increase, then decrease the air in a vaccum environment when there are the following inside:
1) A balloon
2) Marshmellows
 |
| Our theory on what should occur to the marshmellow |
 |
| Balloon inside vacuum |
The first video shows what occurs to the balloon. and how it went from big to small, smaller than its original size to keep note, following our theory
 |
| Marshmallow buddies in the vaccuum environment |
Our second videos shows what occurs to the marshmallows after air goes in, then out. My prediction was that it should be a slightly bigger size, which was proven to be incorrect


No comments:
Post a Comment