However, before the lab was started, a demonstration of heat flow was presented using a bubble made with ethanol and fire to show how heat flow (since ethanol is lighter than air, the bubble goes high in the air, and the fire caused it to pop, spreading the ethanol fire concoction)

Our theory on the ethanol bubble. The force vector of the bubble was our prediction that the bubble should be light enough to float, while the second one shows our theory on how the bubble should do when it comes in contact with fire; stating that when the fire pops, the fire should spread out, while still temporarily lifting up.
 |
| The awesome demonstration of burning bubbles |
We then jumped right into the experiment, by first understanding how the transfer of heat goes.
We did so by taking two cups of water of equal mass, one at around room temperature (25°C) and another at 65°C, and mixed them together, to obtain a two part graph, one line showing the hot water cooling down, and another to show the cool water heating up, until they average out.
We did so by taking two cups of water of equal mass, one at around room temperature (25°C) and another at 65°C, and mixed them together, to obtain a two part graph, one line showing the hot water cooling down, and another to show the cool water heating up, until they average out.
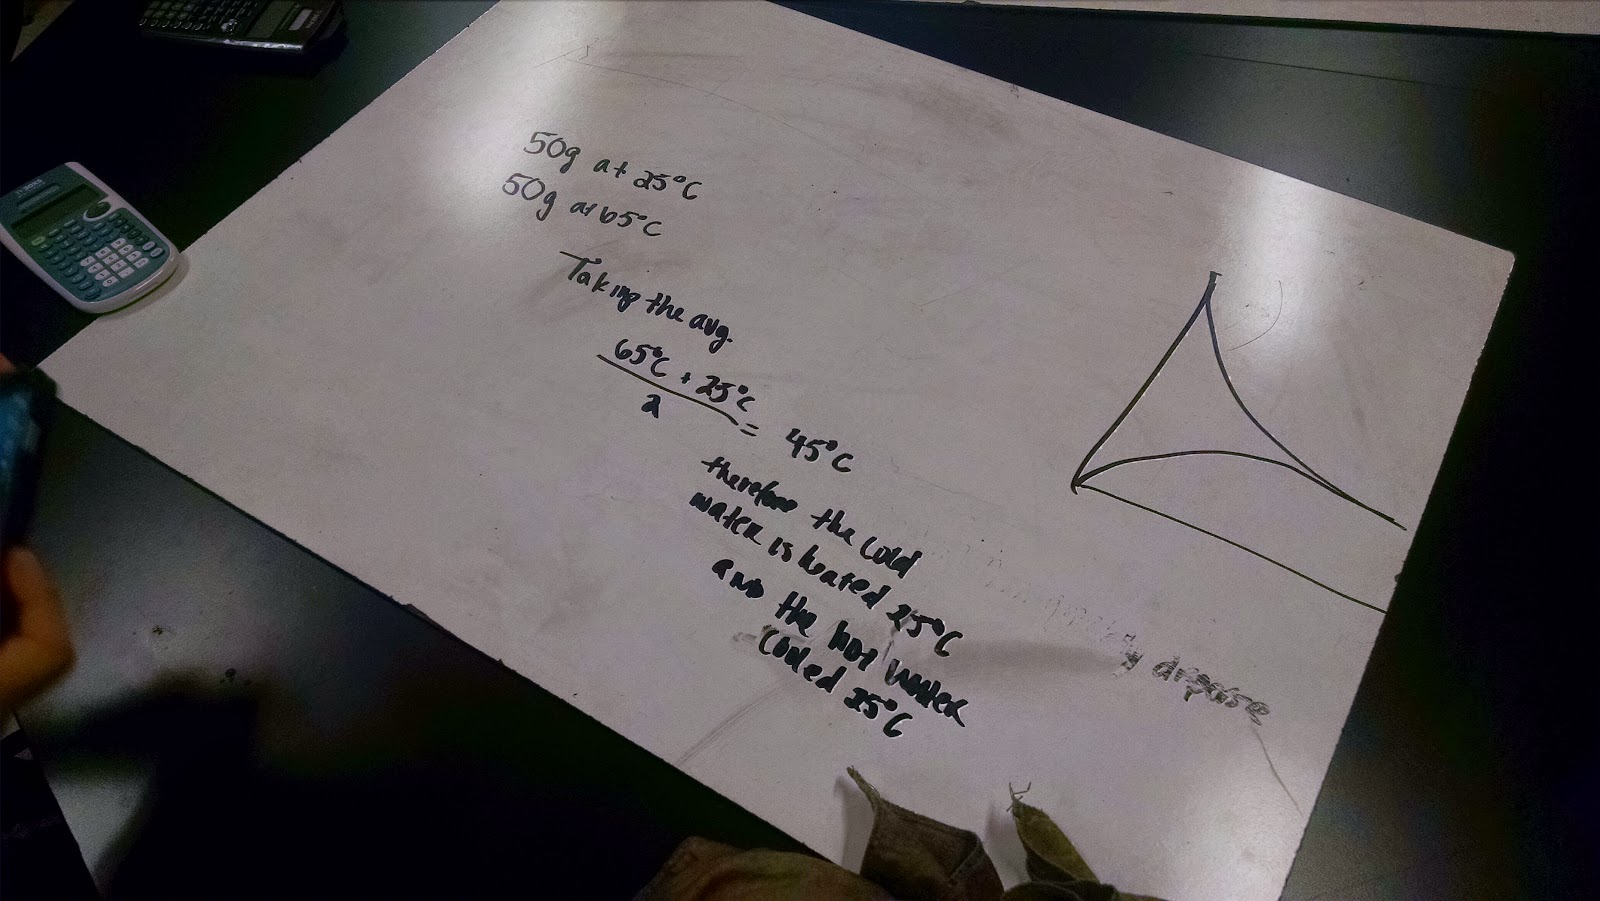 |
| A theory of where the heat should average in at, along with our prediction of the graph |
We then did it again, this time doubling the mass of the cold water, while keeping the mass of the hot water the same to see if mass correlates with the change in temperature
Our third attempt shows what could occur if we were to have a 3rd substance (in this case aluminum) play a part
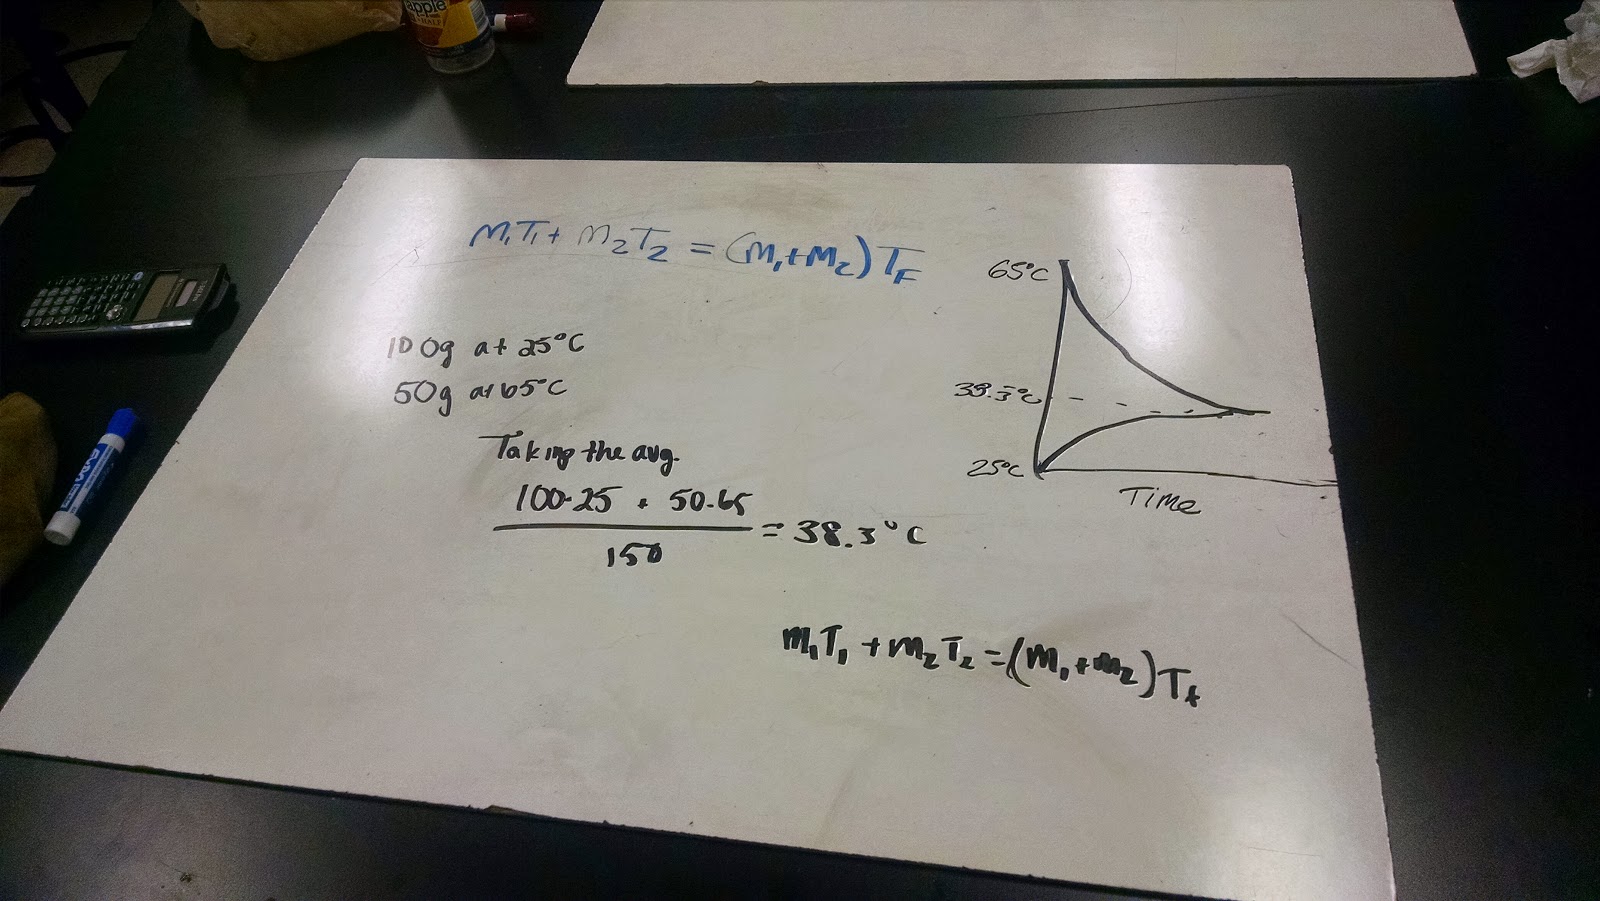 |
| Round 2, showing that the difference in mass makes a difference |
 |
| The graphical results of our experiment, showing a slower, yet similar cooling process to the others experiments |
 |
| The third experiment shows that a third substance just slows down the process of equilibrium |
 |
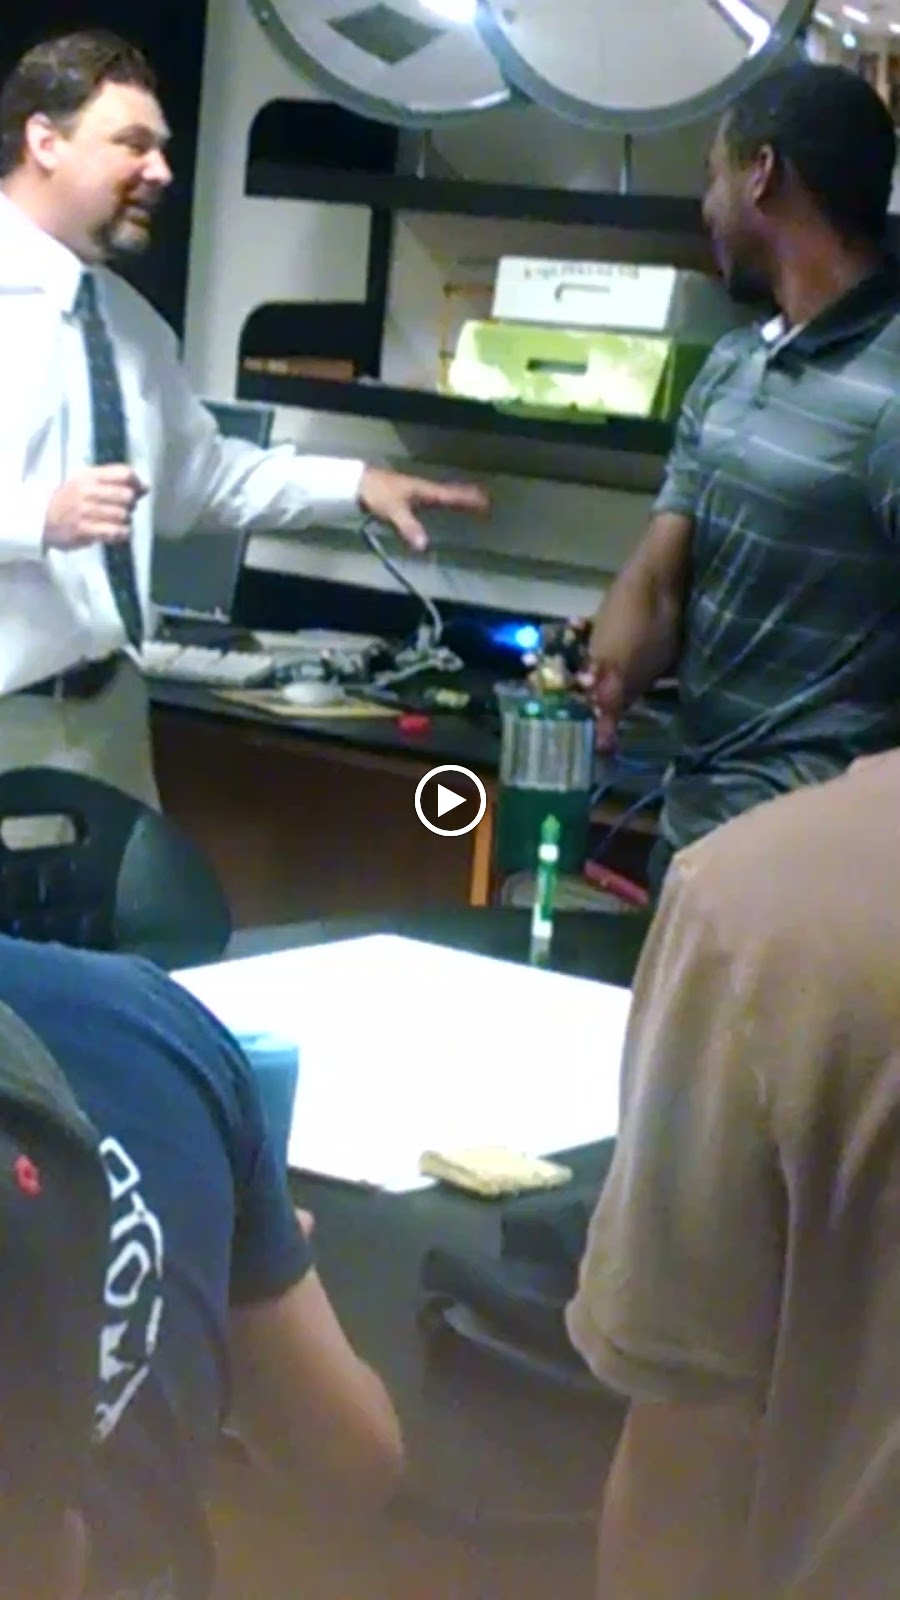
| A class discussion, asking how to make it get colder faster |
The class discussion asked how to make a water bottle container colder, giving us free reign over matterials and surroundings
Our five choices were the following:
- Increasing surface area
- Decreasing the pressure
- Placing it in a colder external temperature (such as a freezer unit)
- changing the materials of a container (such as from plastic to gold, which can contain heat at a much better pace)
- Lessen the volume of the liquid
We then hit the final portion of the lab - Heat Transfer as Energy Exchange. In this portion of the lab, we used an immersion heater in order to quickly heat up the water, then obtain graphs and translated them as needed
 |
| Essentially, the lab set up (minus the computer and loggerpro) |
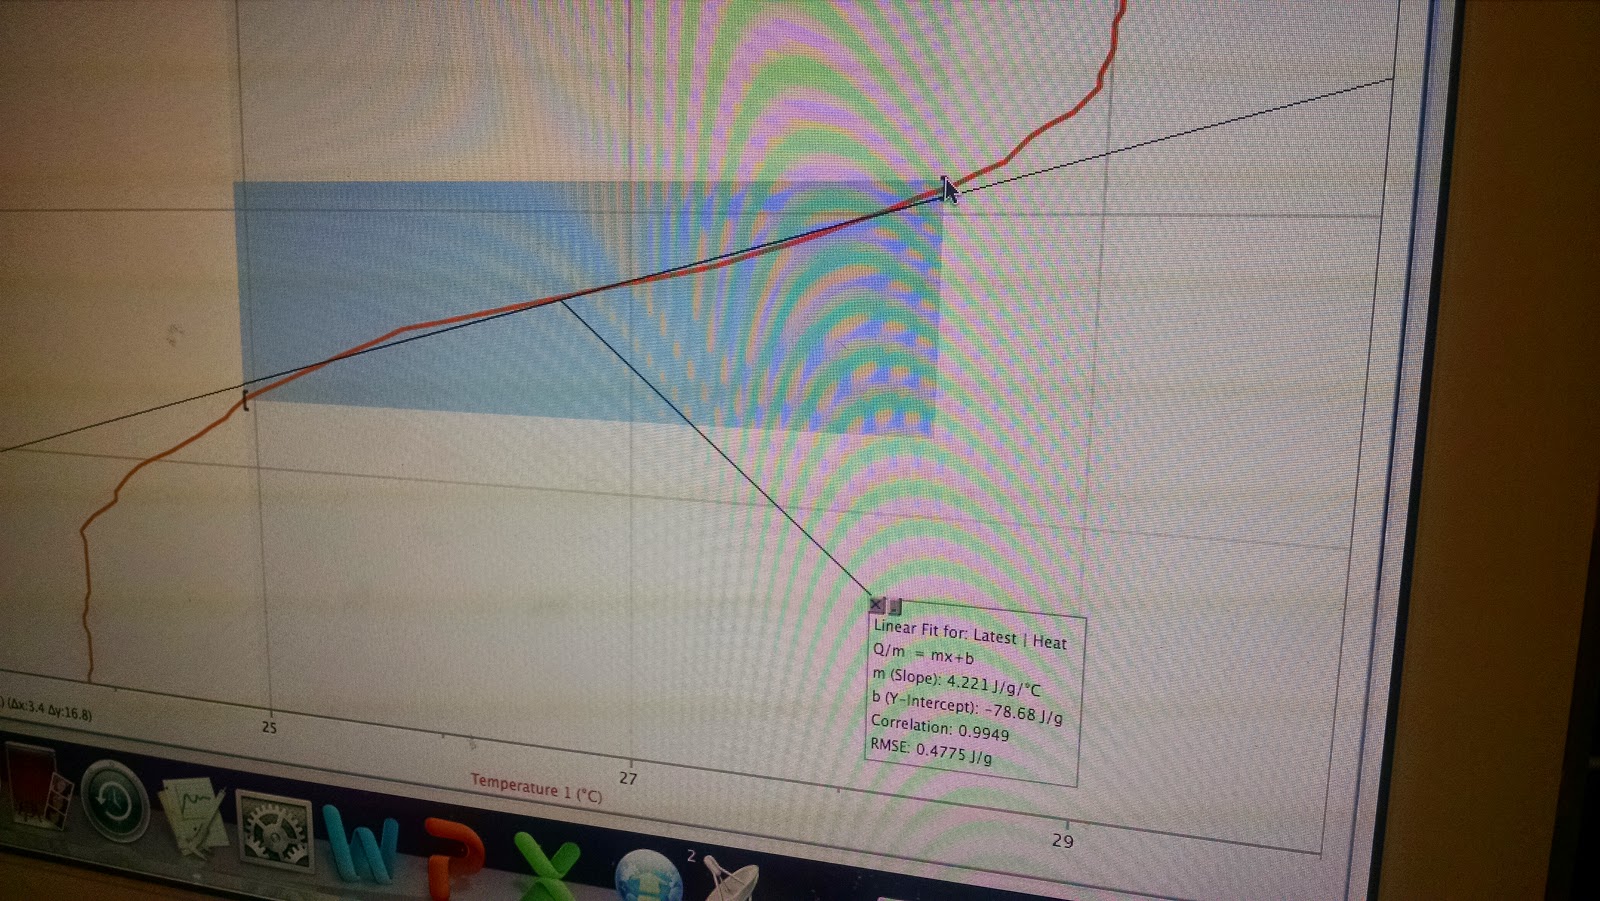 |
| The final and important graph - Heat vs. Temperature graph |
 |
| The translation of the graph, from y=mx+b obtained from the graph to a more known (and familiar) equation |
Final Temperature : 29.1°C